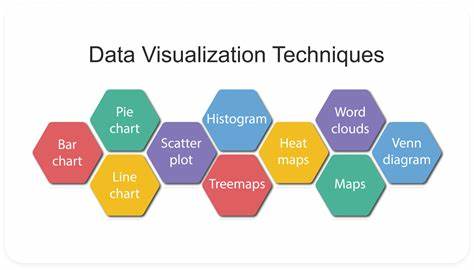
Data Visualization
Categories:
Data visualization နည်းလမ်းများအား နားလည်လွယ်စေရန် မြန်မာဘာသာဖြင့် ဘာသာပြန်ဆိုခြင်းဖြစ်ပါသည်။
Discover more from naywinaung
Subscribe to get the latest posts sent to your email.
Related Post
Chapter 6 ဟာ စာရင်းအင်းဆိုင်ရာ ကောက်ချက်ချခြင်း (statistical inference) မှာ ပထမဆုံးအရေးကြီးတဲ့အပိုင်းဖြစ်တဲ့ “ခန့်မှန်းခြင်း” (estimation) ကို အဓိက ရှင်းလင်းထားပါတယ်။ ဒီခန့်မှန်းခြင်း ဆိုတာကတော့ Chapter 5 မှာ တင်ပြခဲ့တဲ့ sampling distribution သီအိုရီနဲ့ Central Limit Theorem ကို အခြေခံထားတာပါ။Chapter 6 ရဲ့
Bessel’s Correctionစာရင်းအင်းနယ်ပယ်တွင် ဒေတာများကို ခွဲခြမ်းစိတ်ဖြာရာတွင် တိကျမှုနှင့် ယုံကြည်စိတ်ချရမှုသည် အဓိက အချက်ဖြစ်သည်။ အထူးသဖြင့် sample ဒေတာများမှ population ကို ခန့်မှန်းရန် ကြိုးစားချိန်တွင် အမှားများကို ရှောင်ရှားရန် လိုအပ်ပါသည်။ ဤနေရာတွင် Bessel’s correction ဟူသော ချိန်ညှိနည်းလမ်းသည် အရေးပါလာပါသည်။ Bessel’s Correction ဆိုတာ ဘာလဲ။Bessel’s correction သည်
Dunning-Kruger EffectDunning-Kruger Effect ဆိုတာက စိတ်ပညာနယ်ပယ်မှာ လူတွေရဲ့ ကိုယ့်ကိုယ်ကိုယ် အရည်အချင်းအကဲဖြတ်မှုနဲ့ ပတ်သက်တဲ့ ဖြစ်စဉ်တစ်ခုပါ။ ဒီ effect ကို စတင်လေ့လာခဲ့တဲ့ David Dunning နဲ့ Justin Kruger တို့ရဲ့ သုတေသနအရ၊ အရည်အချင်းနည်းပါးတဲ့သူတွေဟာ သူတို့ရဲ့ အစွမ်းအစကို လွန်ကဲစွာ အထင်ကြီးတတ်ပြီး၊ အရည်အချင်းမြင့်မားတဲ့သူတွေကတော့ သူတို့ရဲ့ စွမ်းရည်ကို သိပ်မယုံကြည်တတ်ဘူးလို့